Advanced Excel Proficiency: 6 Practical Solutions for Data Analysis
Advertisements

Developing advanced Excel proficiency is crucial for data analysis roles, enabling professionals to efficiently manipulate, analyze, and visualize complex datasets for informed decision-making and career advancement.
Are you looking to elevate your career in data analysis? Mastering advanced Excel proficiency isn’t just an advantage; it’s a fundamental requirement in today’s data-driven landscape. This guide will explore practical solutions to sharpen your Excel skills, transforming you into an indispensable data professional.
Mastering Advanced Formulas and Functions
To achieve true advanced Excel proficiency, a deep understanding and practical application of complex formulas and functions are non-negotiable. These tools enable you to perform intricate calculations, extract specific data, and automate repetitive tasks, significantly boosting your efficiency and analytical capabilities.
Beyond the basic SUM and AVERAGE, Excel offers a rich library of functions that can revolutionize how you interact with data. Becoming adept at these advanced functions allows for dynamic data manipulation and insightful analysis, which is critical in any data analysis role.
Conditional and Lookup Functions
Conditional functions like IF, IFS, SUMIF, COUNTIF, and AVERAGEIF allow you to perform calculations based on specific criteria. Lookup functions such as VLOOKUP, HLOOKUP, INDEX, and MATCH are essential for retrieving data from large datasets, making data consolidation and reporting much simpler.
- VLOOKUP/HLOOKUP: Efficiently search for and retrieve data from tables based on a specified value.
- INDEX/MATCH: A more flexible and powerful alternative to VLOOKUP for retrieving data from any column.
- SUMIFS/COUNTIFS: Perform summations or counts based on multiple criteria, enabling more nuanced data aggregation.
- IF/IFS: Create conditional logic within your spreadsheets for dynamic decision-making and classification.
Text, Date, and Time Functions
Manipulating text strings, dates, and times is a common task in data cleaning and preparation. Functions like CONCATENATE, LEFT, RIGHT, MID, FIND, REPLACE, and TEXT are invaluable for transforming raw data into a usable format. Similarly, DATE, MONTH, YEAR, NETWORKDAYS, and DATEDIF help analyze temporal data effectively.
By combining these functions, you can create powerful, multi-step calculations that address complex analytical challenges. Practice is key to mastering these, so apply them to various real-world datasets to solidify your understanding and build confidence.
Mastering advanced formulas and functions is the cornerstone of advanced Excel proficiency. It empowers data analysts to tackle complex problems with efficiency and precision, laying the groundwork for more sophisticated data manipulation and reporting.
Leveraging PivotTables and PivotCharts for Dynamic Reporting
PivotTables and PivotCharts are arguably two of Excel’s most powerful features for data analysis and reporting. They allow you to quickly summarize, analyze, explore, and present large datasets, uncovering trends and patterns that would be difficult to spot otherwise. Developing expertise in these tools is crucial for anyone aiming for advanced Excel proficiency.
These dynamic reporting tools enable you to transform raw data into meaningful insights with just a few clicks. Understanding how to structure your data for optimal PivotTable use and how to interpret the results is a vital skill for data analysts.
Creating and Customizing PivotTables
The process begins with clean, structured data. Once your data is ready, creating a PivotTable involves selecting your data range and defining the fields for rows, columns, values, and filters. Customization is where the real power lies, allowing you to change summary functions, group data, and apply various formatting options.
- Data Preparation: Ensure your data is in a tabular format with clear headers and no blank rows/columns.
- Field Selection: Drag and drop fields into the appropriate areas (Rows, Columns, Values, Filters) to build your report.
- Value Field Settings: Change summary calculations (Sum, Count, Average, Min, Max) and show values as percentages or running totals.
- Grouping Data: Group dates by month, quarter, or year, and numbers into custom ranges for better analysis.
Enhancing Reports with PivotCharts and Slicers
PivotCharts provide a visual representation of your PivotTable data, making trends and insights easier to comprehend. Slicers, on the other hand, offer an intuitive way to filter PivotTable data, allowing for interactive and dynamic reports. Combining these elements creates highly effective and user-friendly dashboards.
Regular practice with various datasets will help you discover the full potential of PivotTables and PivotCharts. Experiment with different layouts, calculations, and visual representations to find the most impactful ways to present your data. This hands-on experience is vital for developing true advanced Excel proficiency.
Mastering PivotTables and PivotCharts significantly enhances your ability to perform dynamic data analysis and create compelling reports. These skills are invaluable for showcasing insights and supporting data-driven decisions within any organization.
Data Validation and Conditional Formatting for Data Integrity
Maintaining data integrity and enhancing readability are critical aspects of data analysis. Excel’s Data Validation and Conditional Formatting features are powerful tools that help achieve these goals, making your spreadsheets more robust, user-friendly, and less prone to errors. Attaining advanced Excel proficiency means skillfully applying these features.
By proactively implementing data validation rules, you can prevent incorrect data entry, ensuring the accuracy and consistency of your datasets. Conditional formatting, conversely, highlights important information, making patterns and anomalies immediately visible to the user.
Implementing Data Validation Rules
Data Validation allows you to define rules for the type of data that can be entered into a cell. This can range from restricting entries to specific numbers, dates, or text lengths, to creating dropdown lists from a predefined set of values. It’s a proactive measure against data errors.
- List Validation: Create dropdown menus to ensure consistent data entry (e.g., department names, status types).
- Number/Date Restrictions: Limit entries to a specific range, preventing out-of-bounds values.
- Text Length: Control the number of characters allowed in a cell for standardized inputs.
- Custom Formulas: Apply complex rules using formulas to validate data based on conditions in other cells.
Applying Conditional Formatting for Visual Insights
Conditional Formatting automatically applies formatting (colors, icons, data bars) to cells based on their content. This visual cue helps identify trends, outliers, and critical information at a glance, transforming raw data into actionable insights.
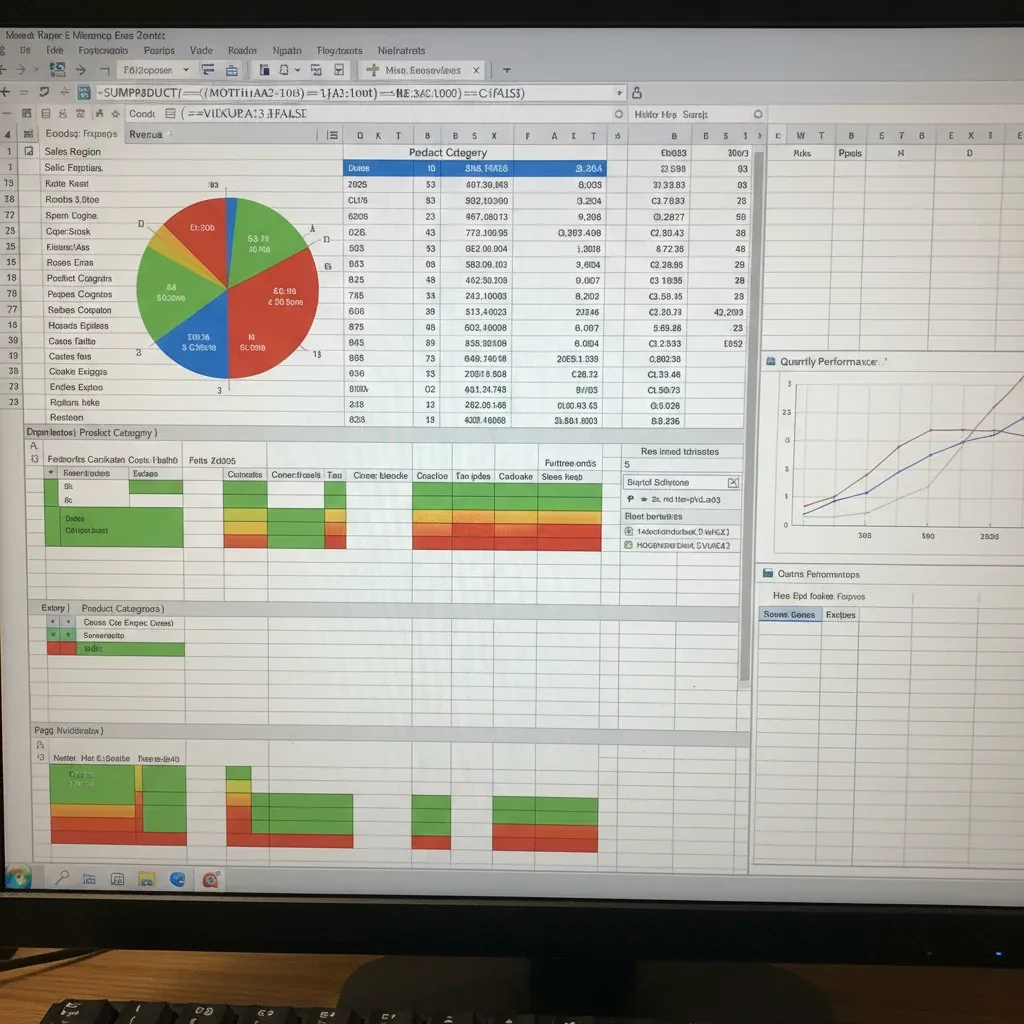
Experiment with different conditional formatting rules, such as color scales, icon sets, and data bars, to find the most effective visual representation for your data. This not only makes your spreadsheets more professional but also streamlines the analysis process for others. Leveraging these features is a clear indicator of advanced Excel proficiency.
Effectively using Data Validation and Conditional Formatting significantly improves the quality and interpretability of your data. These features are essential for any data analyst looking to ensure data accuracy and present insights clearly.
Automating Tasks with Macros and VBA
For data analysts, time is a precious commodity. Repetitive tasks, such as data cleaning, formatting, or report generation, can consume significant hours. This is where macros and Visual Basic for Applications (VBA) become indispensable, allowing you to automate these tasks and achieve true advanced Excel proficiency.
VBA is the programming language embedded within Excel that enables you to write custom scripts to control almost every aspect of the application. Learning VBA can transform you from an Excel user into an Excel developer, opening up new possibilities for automation and custom solutions.
Recording and Editing Macros
The simplest way to start with automation is by recording a macro. Excel records your actions and generates the corresponding VBA code. While recorded macros are useful, understanding how to edit and refine this code is crucial for making them more flexible and robust.
- Macro Recorder: A great starting point to understand the basic VBA syntax for common tasks.
- Relative vs. Absolute References: Understand when to use each for flexible macro execution across different data ranges.
- VBA Editor (Alt + F11): The environment where you can view, edit, and write VBA code.
- Debugging: Learn to identify and fix errors in your VBA code to ensure smooth operation.
Writing Custom VBA Code for Complex Automation
Beyond recording, writing custom VBA code allows you to automate highly specific and complex tasks that the macro recorder cannot handle. This includes creating custom functions, interacting with other applications, and building user forms for data input.
Start with small, manageable projects, such as automating a specific report or cleaning a particular dataset. As you gain confidence, you can tackle more complex challenges. Online tutorials, documentation, and community forums are excellent resources for learning VBA and expanding your advanced Excel proficiency.
Automating tasks with macros and VBA drastically increases efficiency and reduces the potential for human error. This skill set is highly valued in data analysis roles, enabling you to focus on strategic analysis rather than manual data manipulation.
Advanced Charting and Data Visualization Techniques
Effective data visualization is paramount for conveying insights clearly and persuasively. Advanced Excel proficiency extends beyond creating basic bar and pie charts; it involves selecting the right chart type for your data, customizing it for maximum impact, and using advanced techniques to tell a compelling data story.
The goal of data visualization is to make complex data understandable at a glance. A well-designed chart can highlight trends, outliers, and relationships that might be hidden in raw numbers, enabling faster and more informed decision-making.
Beyond Basic Charts: Choosing the Right Visualization
While column and line charts are useful, many other chart types offer more specific insights. Scatter plots reveal relationships between two variables, bubble charts add a third dimension, and combination charts can display multiple data series with different scales.
- Scatter Plots: Ideal for showing the relationship between two numerical variables.
- Bubble Charts: Similar to scatter plots but with an additional dimension represented by bubble size.
- Combination Charts: Useful for displaying different types of data on a single chart (e.g., sales figures and growth rates).
- Sparklines: Tiny charts within a cell that show trends in a series of values, great for dashboards.
Customizing Charts for Impact and Clarity
A standard Excel chart often needs significant customization to be truly effective. This includes adjusting axes, adding data labels, using meaningful titles, removing clutter, and choosing appropriate color schemes. The aim is to make the chart self-explanatory and visually appealing.
Explore Excel’s extensive formatting options for charts, including chart elements, styles, and colors. Pay attention to principles of good data visualization, such as minimizing chart junk and maximizing the data-ink ratio. Practice creating various chart types and customizing them to effectively communicate different types of data stories. This dedication will significantly boost your advanced Excel proficiency.
Mastering advanced charting and data visualization techniques allows you to transform raw data into compelling visual narratives, making your analyses more accessible and impactful to a wider audience. This is a crucial skill for any data analyst.
Integrating Excel with External Data Sources and Tools
In modern data analysis, Excel rarely operates in isolation. Advanced Excel proficiency now involves seamlessly integrating Excel with various external data sources and other analytical tools. This capability allows data analysts to pull data from diverse systems, perform complex transformations, and even push results to other platforms, creating a more comprehensive data ecosystem.
The ability to connect Excel to external data sources eliminates manual data entry, reduces errors, and ensures that your analyses are based on the most current information available. This integration is vital for maintaining data consistency and efficiency.
Connecting to Databases and Web Sources
Excel offers powerful features to connect directly to databases (like SQL Server, Access) and web data. Using Power Query (Get & Transform Data) allows you to import, clean, and transform data from a multitude of sources without writing complex code. This is a game-changer for data preparation.
- Power Query: Import data from databases, web, text/CSV files, and other Excel workbooks.
- SQL Server Integration: Connect directly to SQL databases to pull specific tables or query results.
- Web Data Import: Extract data from tables on web pages, which can be invaluable for competitive analysis or market research.
- Refreshing Data: Learn to set up automatic data refreshes to keep your reports current.
Utilizing Power Pivot and Power BI Integration
For handling massive datasets and performing advanced data modeling, Power Pivot is an essential Excel add-in. It allows you to create relationships between multiple tables, build complex data models, and use Data Analysis Expressions (DAX) for powerful calculations. Integrating Excel with Power BI further extends your capabilities for interactive dashboards and reporting.
Familiarize yourself with the Power Query Editor for data transformation and the Power Pivot data model for advanced calculations. Exploring how Excel data can be leveraged within Power BI dashboards will significantly enhance your analytical and reporting toolkit. This level of integration is a hallmark of advanced Excel proficiency in contemporary data analysis roles.
Integrating Excel with external data sources and tools is crucial for building robust and dynamic data analysis solutions. This capability ensures your analyses are comprehensive, current, and connected to the broader data landscape.
| Key Solution | Brief Description |
|---|---|
| Advanced Formulas | Utilize complex functions like INDEX/MATCH and SUMIFS for intricate data manipulation. |
| PivotTables/Charts | Dynamically summarize and visualize large datasets for insightful reporting. |
| Macros & VBA | Automate repetitive tasks and customize Excel functions for efficiency. |
| External Data Integration | Connect Excel to databases and web sources for comprehensive data analysis. |
Frequently Asked Questions About Advanced Excel Proficiency
Why is advanced Excel proficiency still important in 2026 for data analysis roles?▼Despite the rise of specialized tools, advanced Excel proficiency remains crucial because it provides a flexible, accessible, and widely adopted platform for quick data exploration, ad-hoc analysis, and powerful reporting, especially for professionals who need to share insights across various departments without specialized software.
What are the key differences between basic and advanced Excel skills?▼Basic Excel skills involve fundamental data entry, simple formulas, and basic formatting. Advanced skills, however, encompass mastering complex functions like INDEX/MATCH, creating dynamic PivotTables, automating tasks with VBA, and integrating with external data sources, enabling more sophisticated analysis and reporting.
Can VBA and macros really automate complex data analysis tasks?▼Absolutely. VBA and macros can automate highly repetitive and complex data analysis tasks, from cleaning and formatting data to generating custom reports and even interacting with other applications. This significantly reduces manual effort, improves efficiency, and minimizes human errors in data processing.
How can I practice and improve my advanced Excel skills effectively?▼The most effective way to improve is through hands-on practice with real-world datasets. Work on personal projects, seek out complex problems at work, participate in online challenges, and utilize platforms offering practical exercises and case studies. Consistent application reinforces learning and builds confidence.
What other tools complement advanced Excel proficiency for data analysts?▼Complementary tools include SQL for database querying, Python or R for advanced statistical analysis and machine learning, and business intelligence platforms like Power BI or Tableau for interactive dashboards and data visualization. These tools, combined with Excel, form a robust data analysis toolkit.
Conclusion
Achieving advanced Excel proficiency is more than just adding a line to your resume; it’s about transforming your capability as a data analyst. The six practical solutions discussed — mastering advanced formulas, leveraging PivotTables, ensuring data integrity, automating with VBA, creating impactful visualizations, and integrating with external data sources — collectively empower you to tackle complex data challenges with confidence and efficiency. In a world increasingly driven by data, these skills will not only enhance your current role but also open doors to new professional opportunities, solidifying your position as an invaluable asset in any data-driven organization.